What if the granularity of operational control, one case at a time, met the rigor of financial planning and cost control, from the model to the monthly variance?
The Shift Is Here
The clinical operations model already changed.
AI tools, delegated vendors, and automation landed across every workflow.
The infrastructure to see what's actually happening didn't.
10xMore Complexity
ZeroMore Control
5-day bootcamp
Your data. Your team at the keyboard. Real PA, CM or Quality cases.
Live scoreboard
on your real operational data, not slides
Your team drives
your ops leads, not our consultants
Decide by Friday
go live, extend, or walk away
Live, not quarterly
Run Clinical Operations on One Ledger Priced, controlled, and proven, case by case
Today the cost lives in a quarterly allocation, the work lives in the queue, and the AI claim lives on a vendor slide. None of them can tell a clean case from a messy one.
Three lenses on the same recorded work, so finance and operations read from one ledger.
Workflow Economics
Price the work. Set the target. Control the gap.
Give each kind of recorded fact one price: a case exists, it visits a step, an exception happens, automation does the work. Every case then prices itself from its own history. Set a cost-per-case target, give each step its share, and read the gap by step, by action and by case, every month.
Model
A price list, not a time study. Reprice the same history under a vendor rate or an AI-first design.
Target
One figure per case, a share per step, a date. The step owner gets a number for their step.
Control
Month → cohort → case. Every count opens the cases behind it; every case opens its ledger.
See where every case stands, and who has it, right now
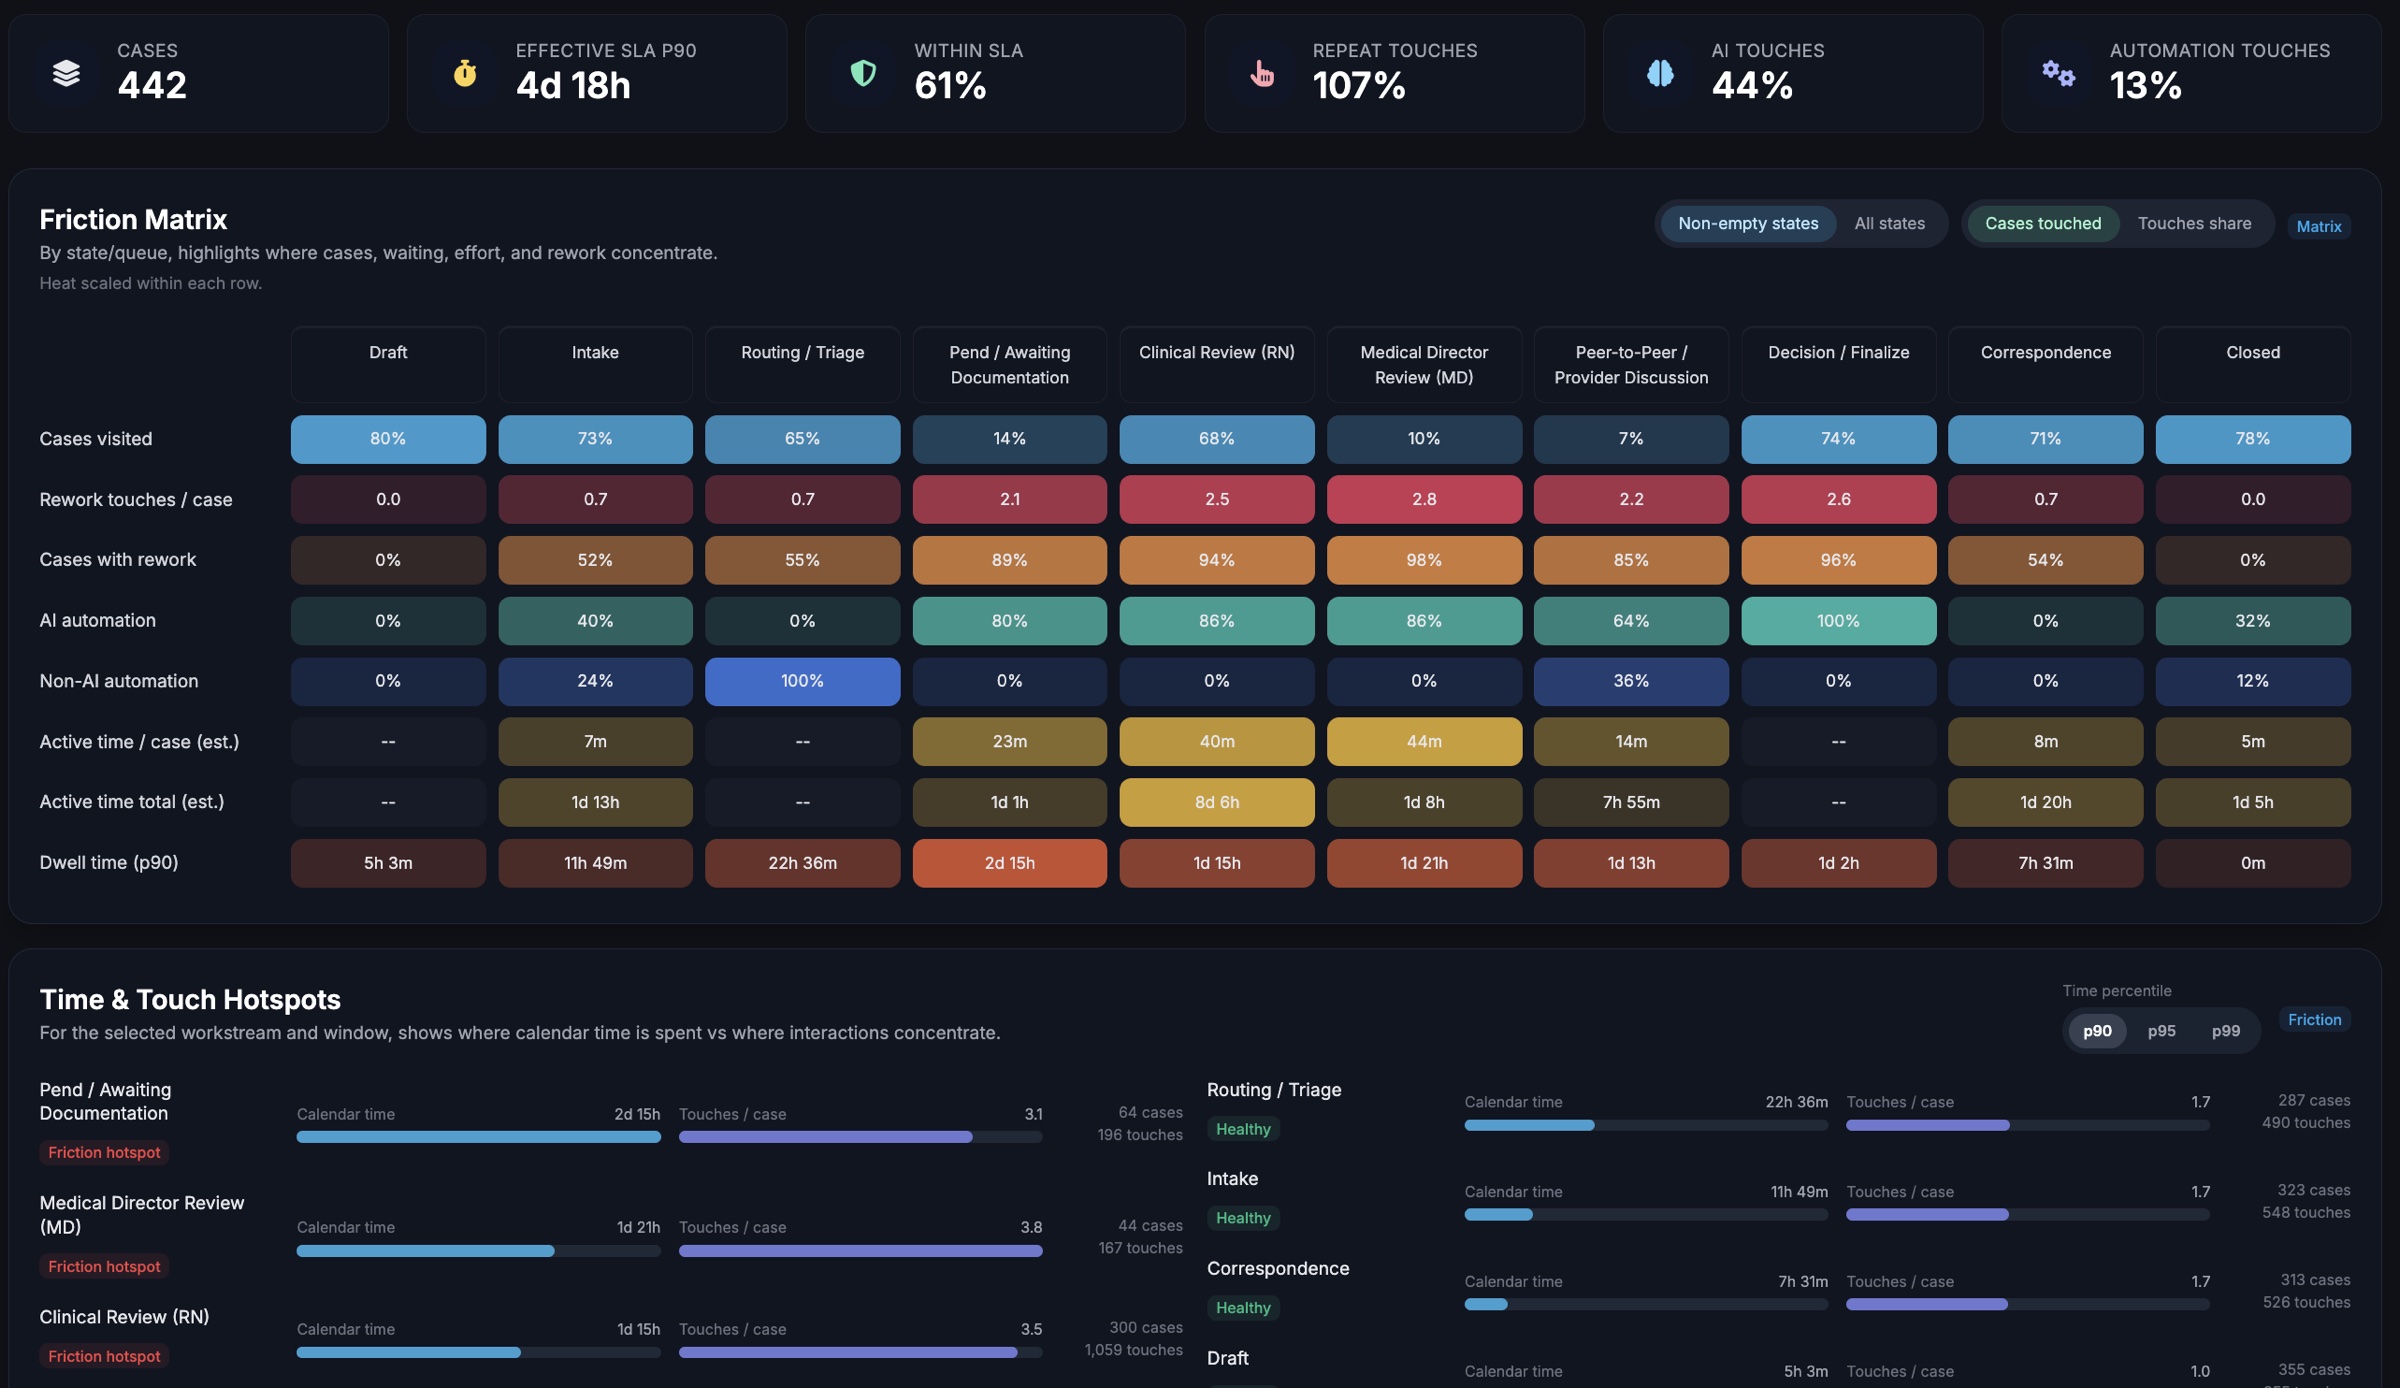
Live heatmap of every case across every stage. Know which SLAs are about to breach, where rework loops concentrate, and which queues need intervention. Every resource ranked by throughput, handle time and cost, internal teams, vendors and AI side by side.
Control TowerSLA ExposureResource LeaderboardLoop Atlas
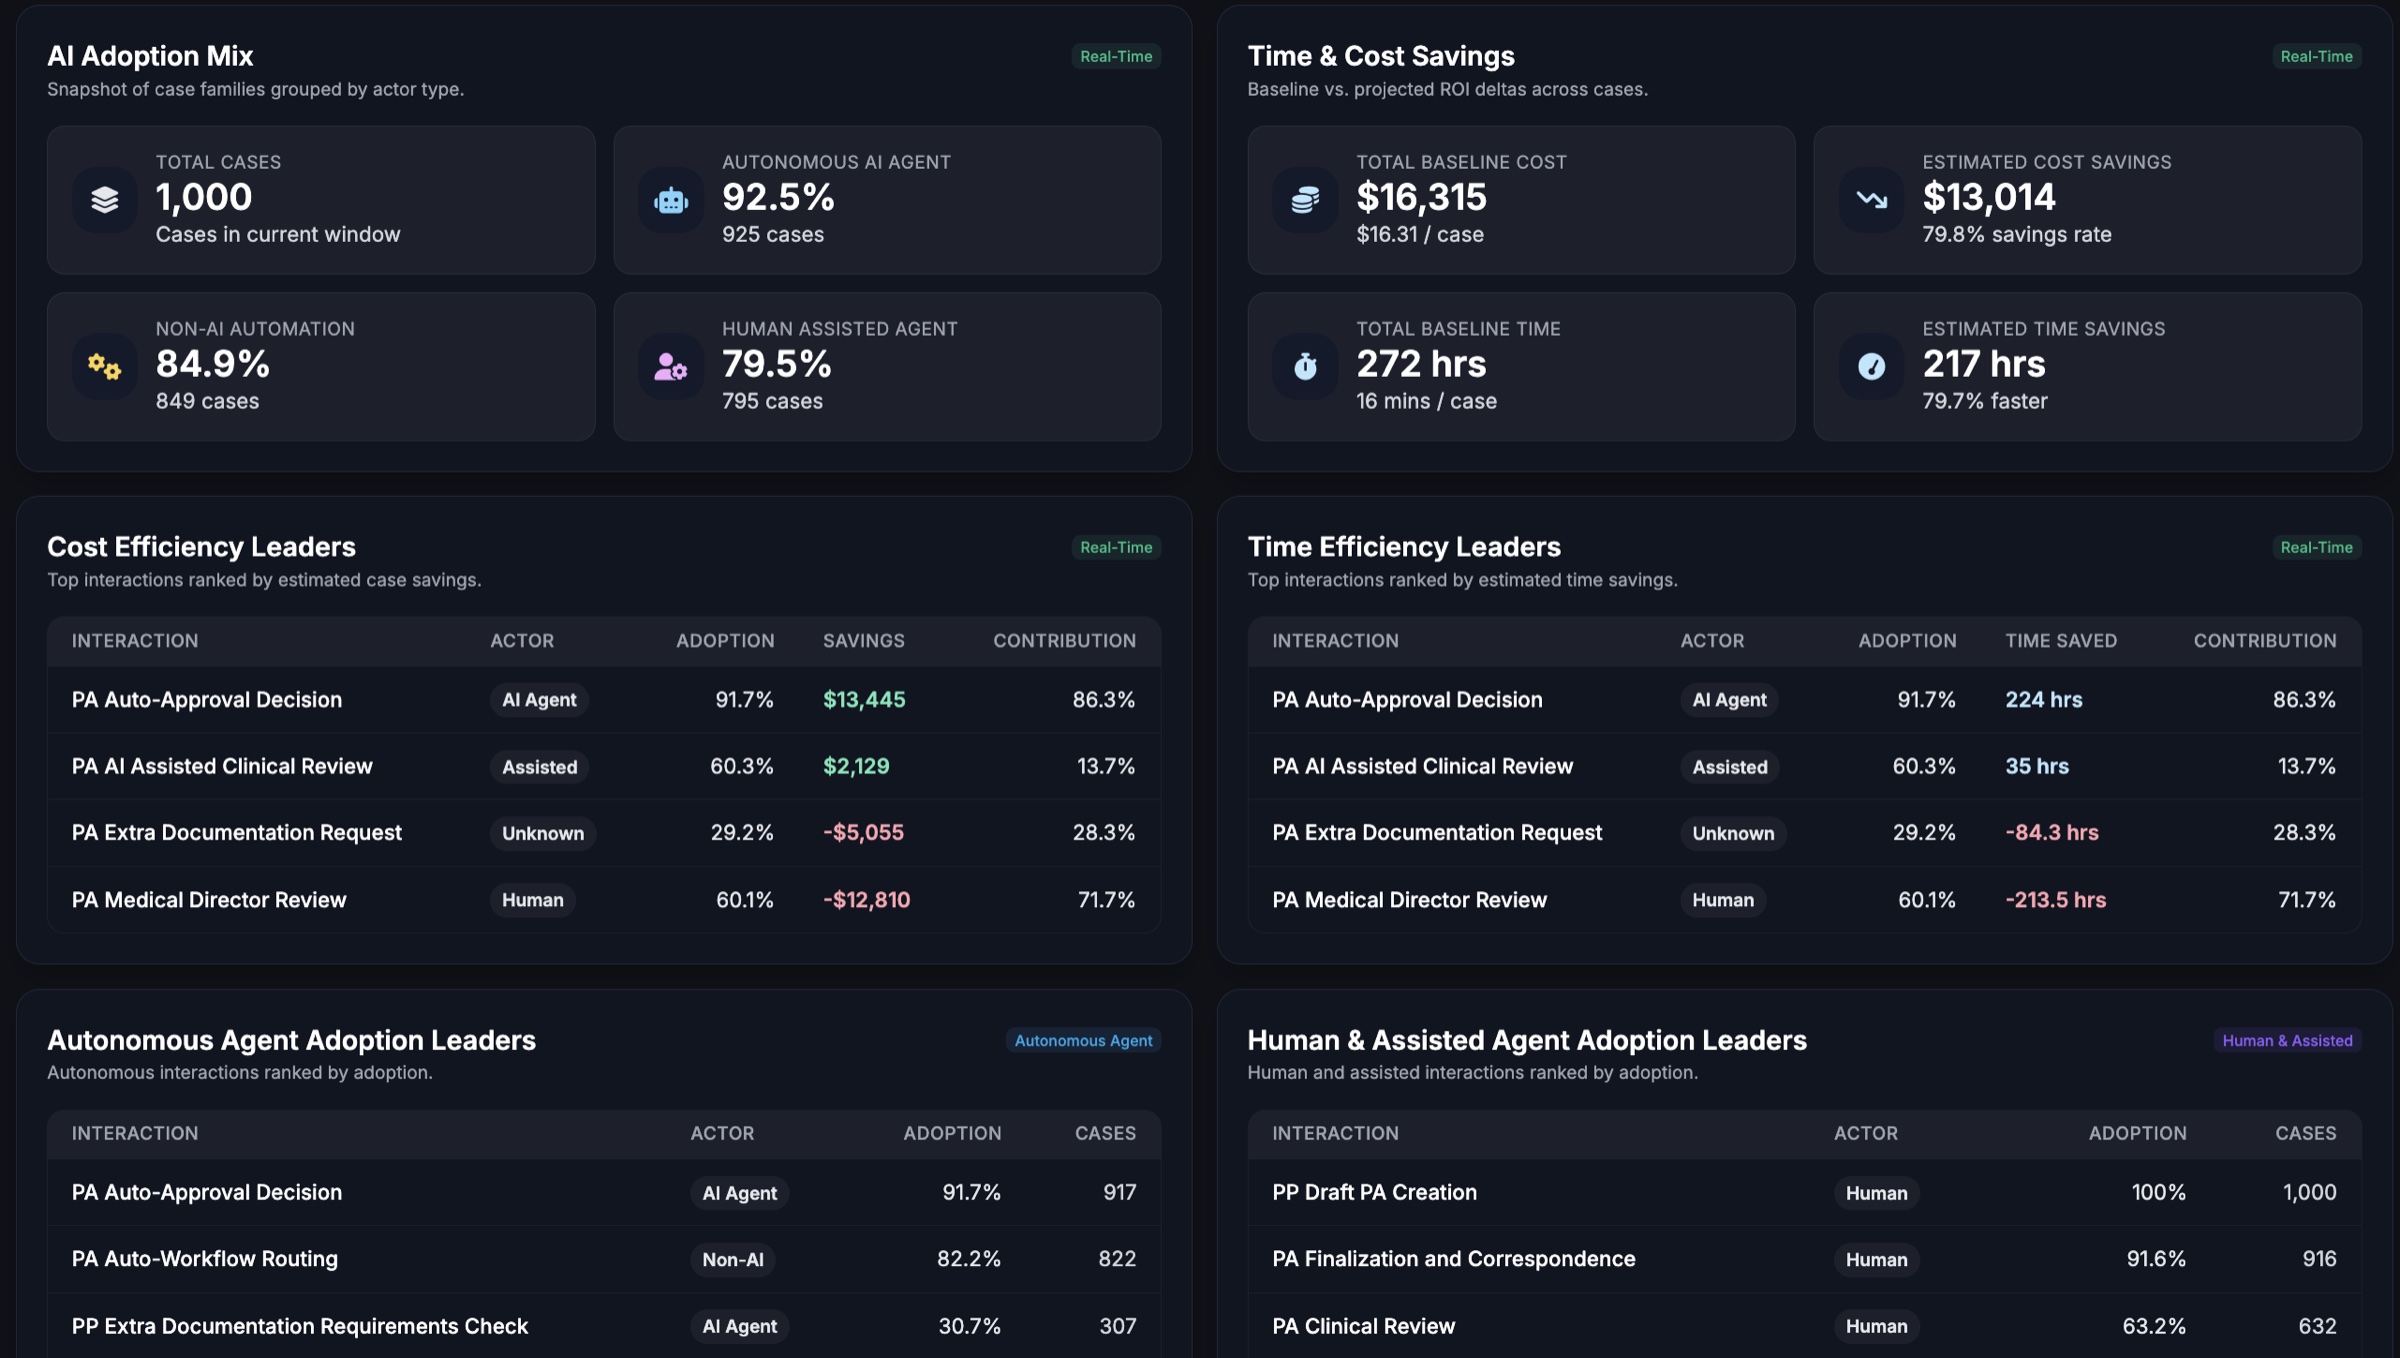
88% of health plans use AI in at least one workflow. ~5% can prove it's delivering value. Operon prices AI-touched cases with the same cost model as the humans and vendors around them, so the business case is a line in the ledger, not a slide from the vendor.
ROI Impact ExplorerAI vs. Human ComparisonAdoption Map
The CFO's number, priced from the operations record.
Budget vs actual by the month the work started, modeled cost against last year’s baseline and this year’s target, with every dollar traceable to a workflow step and an action. Every count opens the cases behind it; every case opens its ledger.
Total modeled cost
$60.5M
1.64M Cases · Jan – Aug 2026
Cost per Case
$36.90
$39.40 in Jan → $34.40 in Aug
Cases by first touch
1.64M
196k in Jan → 208k in Aug
Implied budget · Operational Goal
$52.5M
$32.00 × 1.64M · over by +$8.0M
Effort in window
$57.9M
work dated Jan – Aug · $2.6M of first-touch cost falls after Aug
Total spend divided by volume, refreshed quarterly. No cost per touch, per rework loop, or per step. The $2 improvement cannot be attributed, so it cannot be defended.
Rework loops are invisible cost drivers
Cases loop 2-3x through the same stages. Nobody quantifies the cost of each loop or the margin it consumes.
AI spend has no measurable return
Millions allocated to AI vendors. Budget reviews ask for ROI numbers. All finance has is vendor-reported "efficiency gains."
A vendor rate card cannot be tested before signing
No way to reprice last year's cases under the proposed rate and compare it to today's staffing on the same work.
Operating model is a black box
20 resources, 3 vendors, AI. No unified view of who performs, who underperforms, or that 56% of cases are unassigned.
Can't baseline before vs. after AI
Transformation projects need before/after proof. Without operational baselines, there's no way to measure what AI changed.
IT, Digital & InnovationCIO, CTO, Chief AI Officer, VP Digital Transformation
Human vs. AI cost comparison doesn't exist
Can't compare what a case costs when handled by AI vs. human vs. hybrid on one price list. No data to optimize the mix.
No workflow-level data for AI to learn from
AI metrics live in vendor dashboards. Not tied to actual case outcomes, stages, or process context.
Can't prove AI ROI to the board
AI deployed across 4+ workflows. Board asks for numbers. All you have is "we think it's helping."
Finance & Measurement
CFO, VP Finance, VP Performance Measurement
Workflow Economics
Cost per case is an average, not an account
Total spend divided by volume, refreshed quarterly. No cost per touch, per rework loop, or per step. The $2 improvement cannot be attributed, so it cannot be defended.
Operational Control
Rework loops are invisible cost drivers
Cases loop 2-3x through the same stages. Nobody quantifies the cost of each loop or the margin it consumes.
AI Adoption & ROI
AI spend has no measurable return
Millions allocated to AI vendors. Budget reviews ask for ROI numbers. All finance has is vendor-reported "efficiency gains."
Clinical Leadership
CMO, VP Clinical Ops, VP Quality
Workflow Economics
The step owner has no number for their step
Targets are set per program, per year. Clinical Review has no share of the target and no way to see its contribution to the gap.
Operational Control
SLA breaches surface after the damage is done
Cases cross 10+ stages. Failures show up in monthly reports, weeks too late. No live view of which cases are at risk right now.
AI Adoption & ROI
AI touches cases but clinical impact is unclear
Told AI reduces turnaround. Can't verify from clinical workflow data. No audit trail for AI-driven decisions.
Operations & Vendor Mgmt
COO, VP Vendor Management, VP Transformation
Workflow Economics
A vendor rate card cannot be tested before signing
No way to reprice last year's cases under the proposed rate and compare it to today's staffing on the same work.
Operational Control
Operating model is a black box
20 resources, 3 vendors, AI. No unified view of who performs, who underperforms, or that 56% of cases are unassigned.
AI Adoption & ROI
Can't baseline before vs. after AI
Transformation projects need before/after proof. Without operational baselines, there's no way to measure what AI changed.
IT, Digital & Innovation
CIO, CTO, Chief AI Officer, VP Digital Transformation
Workflow Economics
Human vs. AI cost comparison doesn't exist
Can't compare what a case costs when handled by AI vs. human vs. hybrid on one price list. No data to optimize the mix.
Operational Control
No workflow-level data for AI to learn from
AI metrics live in vendor dashboards. Not tied to actual case outcomes, stages, or process context.
AI Adoption & ROI
Can't prove AI ROI to the board
AI deployed across 4+ workflows. Board asks for numbers. All you have is "we think it's helping."