// Built for the Health Plan Ecosystem

Workflow Economics
for Clinical Operations

What if the granularity of operational control, one case at a time, met the rigor of financial planning and cost control, from the model to the monthly variance?

Case 4817305 · 72h SLA0h 00m$0.00
Draft · Patel, Maya

The ring counts the case against the 72h SLA, marked at 24h, 48h and 72h; the closed case stops at 63h with a checkered flag. Event stream: 37 recorded events, from 0h 00m State Entry · Draft to 63h 19m Next Case Intake Started.

// Live, not quarterly

Run Clinical Operations on One Ledger

Priced, controlled, and proven, case by case

Today the cost lives in a quarterly allocation, the work lives in the queue, and the AI claim lives on a vendor slide. None of them can tell a clean case from a messy one.

  • 250,000 cases this month · time to close × cost per case
  • Time to close from 0h to 96h, with the 72h SLA marked; cost per case from $0 to $80, with the $40 target marked.
  • Clean, on time and on target ($40 or less, 72h or less): 79%, 198,500 cases
  • On time, over target (more than $40, 72h or less): 12%, 29,000 cases
  • Late, on target ($40 or less, more than 72h): 8%, 19,200 cases
  • Messy, late and over (more than $40, more than 72h): 1%, 3,300 cases
  • Highlighted: Case 4817305 · 63h · $47.52, +$7.52 over target, on time.
Workflow Economics

What does a case cost, and what should it?

Cost per case is total spend divided by volume, refreshed quarterly. It cannot say what a second clinical review costs, which step is over its share, or what the new AI vendor actually saved.

Explore Workflow Economics
Operational Control

Where does work go and where does it stall?

Your reports tell you about breaches weeks after they happened. Cases cross 10+ stages, most of the clock burns in queue wait, not review, and you can't see that today.

Explore live case flow
AI Adoption & ROI

Is AI actually changing ops or just generating output?

Vendors report lift, boards want proof, state AI laws now require it. Most teams see model output, not whether the operation downstream actually improved.

Explore AI impact
// Platform Overview

Model It. Control It. Prove It.

Three lenses on the same recorded work. Operations runs the queue on it; finance prices it; both read one ledger.

Workflow Economics

Give each kind of recorded fact one price: a case exists, it visits a step, an exception happens, automation does the work. Every case then prices itself from its own history. Set a cost-per-case target, give each step its share, and read the gap by step, by action and by case, every month.

Model

Cost model · Current Process Model

One-pass cost with Extra and Saving effects on a shared $0–$40 scale.

Base cost per case
$6.00
+ Standard visit costs · 4 States
+$21.00
= One-pass cost
$27.00
+ all Extra effects · 3 rules
+$9.00
− all Saving effects · 3 rules
−$7.00
Unreviewed · 2 rules
unpriced

One-pass cost with all Savings / all Extras: $20.00 – $36.00

Configuration only: one visit per state, each rule at most once. Not a forecast; replay results live in Financial Performance.

Target vs modeled

Goal vs modeled result

Two aligned compositions on one scale. Goal State Targets + Unallocated Target = $30.00; modeled State contributions + Base Cost per Case = $31.50.

Operational Goal · targets$30.00 per case

Intake$5.00
Clinical Review$15.00
Decision$4.00
Unallocated$6.00
$30.00

Current Process Model · modeledreconciles to $31.50

Intake$4.20
Clinical Review$16.40
Decision$2.90
Notif$2.00
Base Cost$6.00
$31.50
Explore Workflow Economics

Operational Control

See where every case stands, and who has it, right now

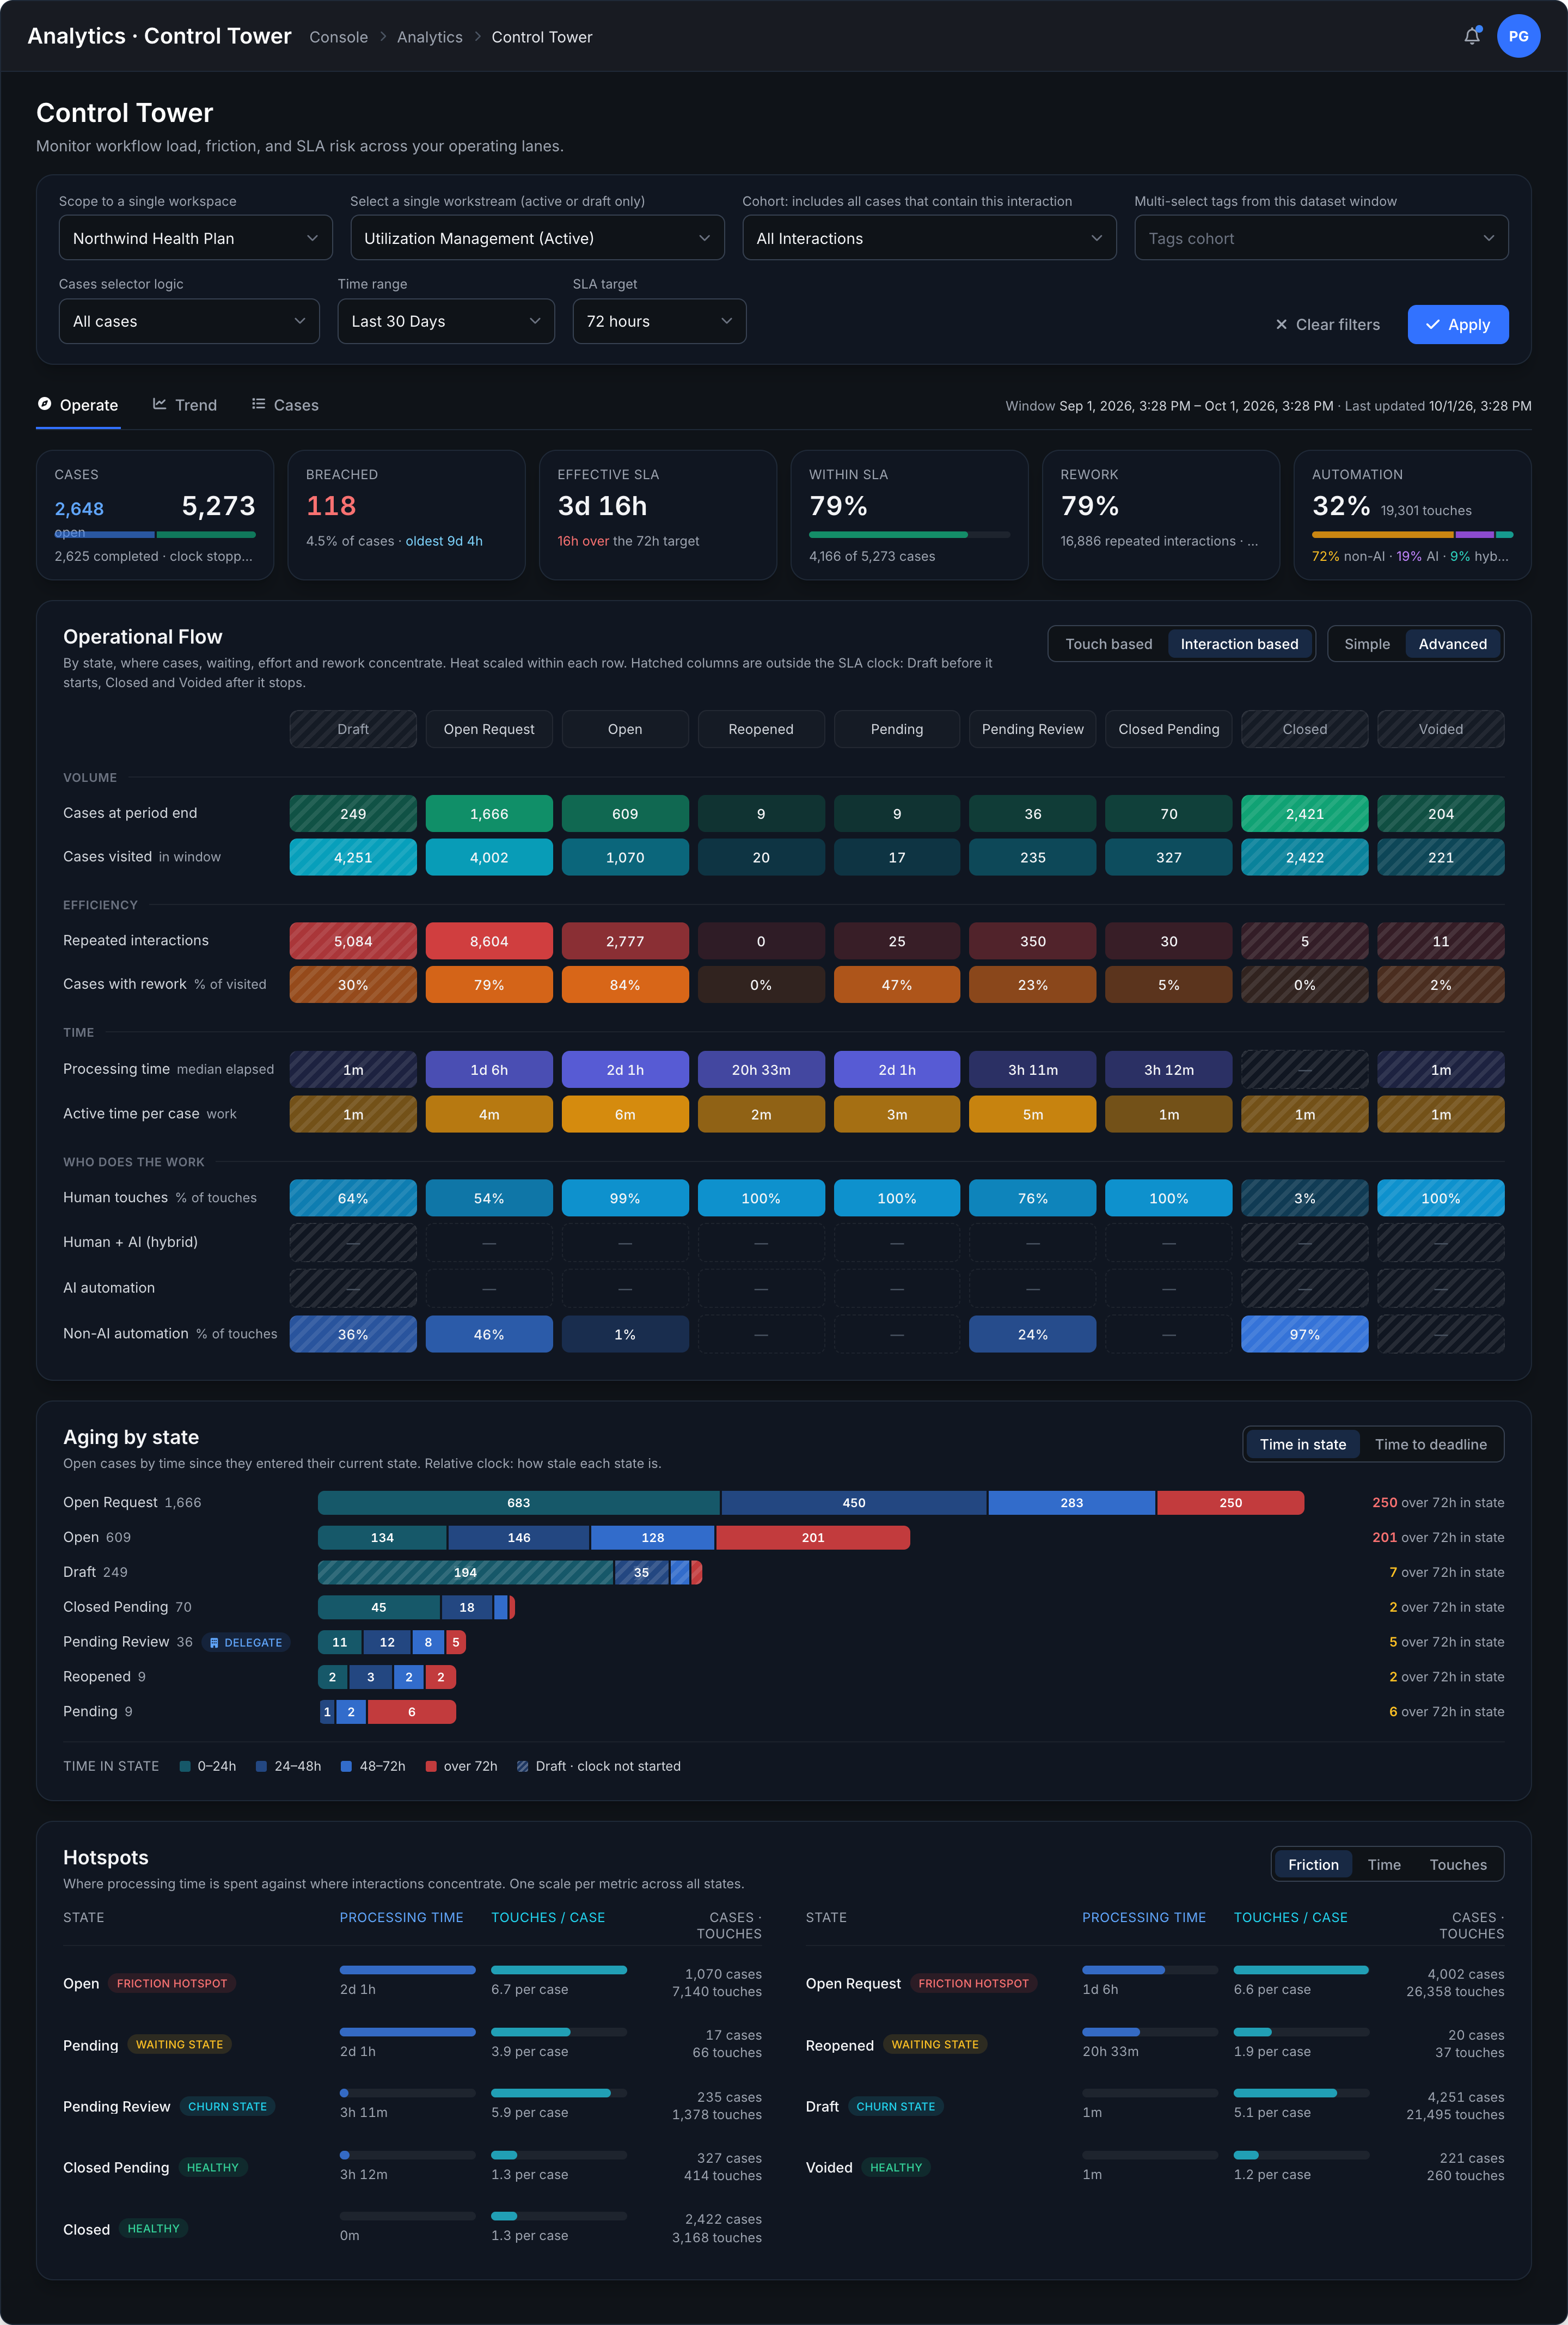
Live heatmap of every case across every stage. Know which SLAs are about to breach, where rework loops concentrate, and which queues need intervention. Every resource ranked by throughput, handle time and cost, internal teams, vendors and AI side by side.

Control TowerSLA ExposureResource LeaderboardLoop Atlas
Control Tower Operational Flow heatmap
Operon.Cloud Control Tower. Example workflow data.
Explore Operational Control

AI Adoption & ROI

Prove what AI changed, in the same ledger

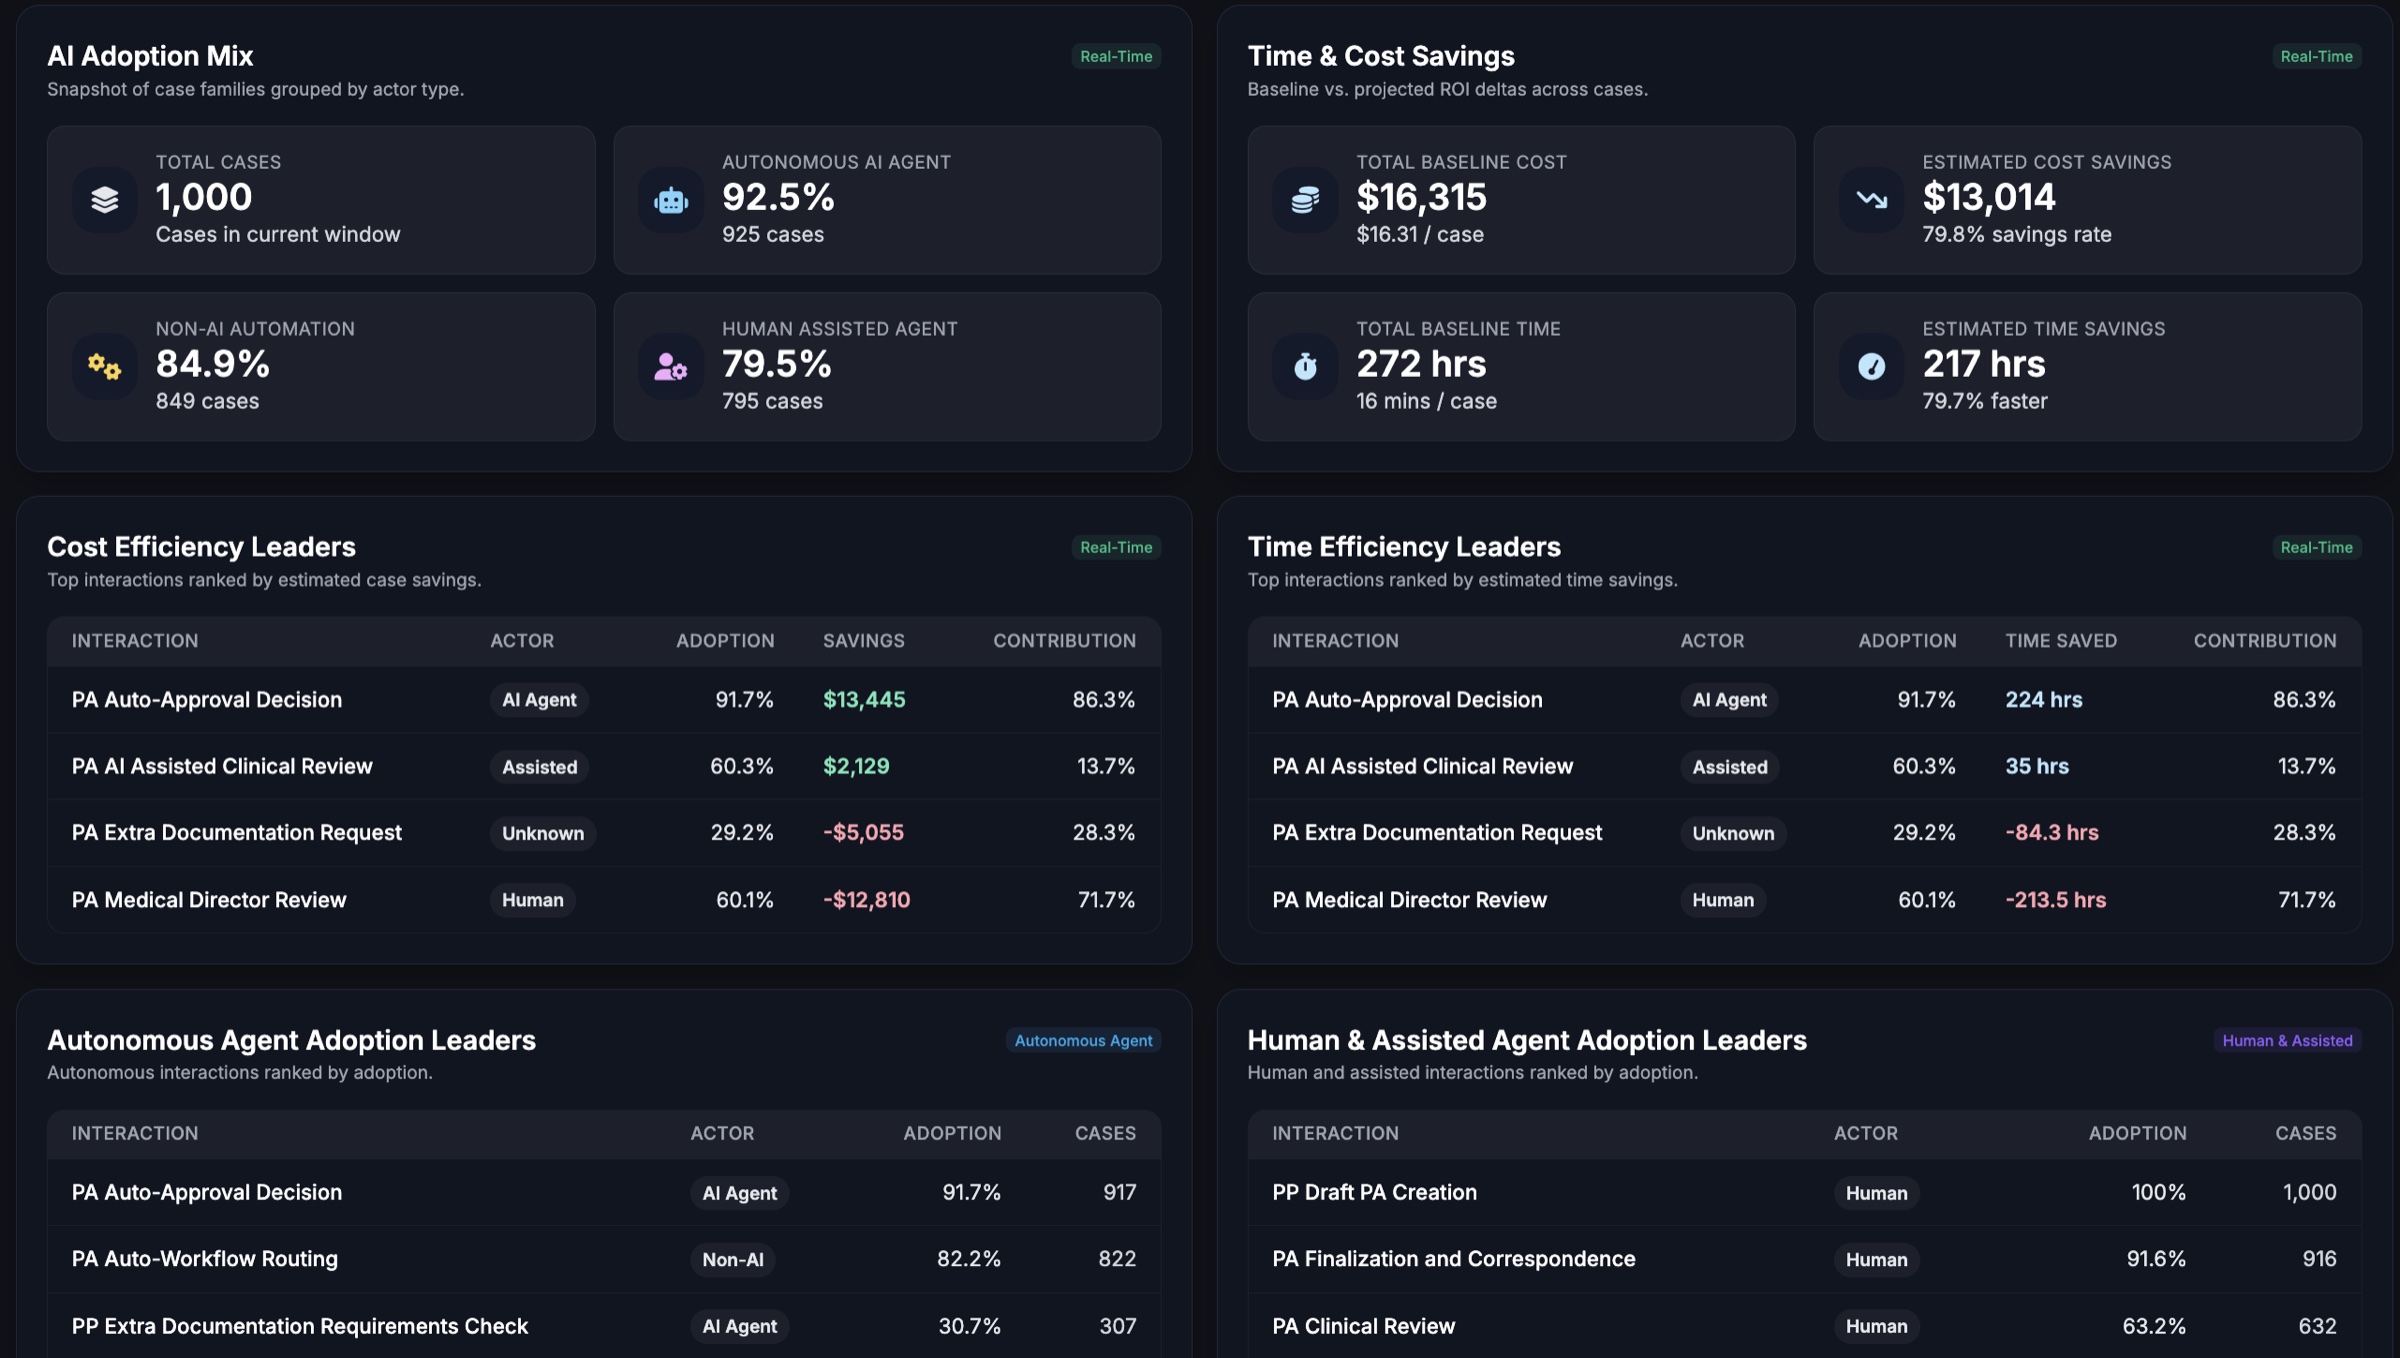
88% of health plans use AI in at least one workflow. ~5% can prove it's delivering value. Operon prices AI-touched cases with the same cost model as the humans and vendors around them, so the business case is a line in the ledger, not a slide from the vendor.

ROI Impact ExplorerAI vs. Human ComparisonAdoption Map
ROI Impact Explorer showing AI adoption metrics and cost savings
Operon.Cloud ROI Impact Explorer. Example workflow data.
Explore AI Adoption & ROI
// Queue to case

The ops lead's queue, case by case, before the SLA hits.

Every case in flight, across every stage, team, vendor and AI step. Where the calendar time burns, where work repeats, and which cases are predicted to miss their SLA next, while there is still time to move them. Every count opens the cases behind it; every resource, delegate and AI actor ranks on the same columns.

Cases
44,200
total · 9,900 active · PA workstream · 10 states · 1,240 resources
Effective SLA p90
4d 18h
most of it dwell time, not active review
Within SLA · active cases
78%
2,200 already exceeded · 1,000 at risk now
Prediction AI risk
4,900
predicted to miss SLA · 3,900 high · 1,000 medium
Repeat touches
107%
touches per case beyond the first · 44% of all touches AI-assisted

Illustrative data · Operational snapshot · Loop Atlas uses a separate 100,000-case sample

Risk AI

Predictive Risk AI

Where active work is most likely to miss SLA next, so action can happen earlier. Color intensity highlights where attention is needed most.

Illustrative
Total
Draft
Intake
Routing / Triage
Pend / Awaiting Documentation
Clinical Review (RN)
Medical Director Review (MD)
Peer-to-Peer / Provider Discussion
Decision / Finalize
Correspondence
Closed
Current state
44,200
400
900
1,300
700
3,500
200
400
2,000
500
34,300
Medium Risk SLA Failure Prediction
1,000
0
0
0
100
400
0
200
300
0
0
High Risk SLA Failure Prediction
3,900
0
0
100
600
1,400
200
200
1,100
300
0
Dwell time
4d 18h
2h 41m
7h 4m
12h 24m
1d 13h
22h 35m
1d 3h
20h 20m
14h 54m
4h 13m
0m

Heat scaled within each row. Total column is the workstream.

Clinical Review: 1,400 high-risk of 3,500 in state · Explore SLA risk

Control Tower

Time & Touch Hotspots

Where calendar time is spent vs where interactions concentrate, for the selected workstream and window.

Pend / Awaiting DocumentationFriction hotspot
Calendar time2d 15h
Touches / case3.1
6,400 cases19,600 touches
Medical Director Review (MD)Friction hotspot
Calendar time1d 21h
Touches / case3.8
4,400 cases16,700 touches
Clinical Review (RN)Friction hotspot
Calendar time1d 15h
Touches / case3.5
30,000 cases105,900 touches
Routing / TriageHealthy
Calendar time22h 36m
Touches / case1.7
28,700 cases49,000 touches
IntakeHealthy
Calendar time11h 49m
Touches / case1.7
32,300 cases54,800 touches
CorrespondenceHealthy
Calendar time7h 31m
Touches / case1.7
31,300 cases52,600 touches
Calendar time (p90)Touches per case
Loop Atlas

Rework loops by interaction

Which interactions repeat inside a case, how often, and what the repeats cost at the model's per-repetition price.

100,000 cases
Loop rate92.2%92,200 cases with loops
Repetitions8.7709,100 occurrences
Time burden22,600 hrsextra time from rework
Cost burden$1.36Mextra cost from rework
InteractionOccurr.Loop rateRepsBurden
PA Auto-Approval Decision91,70099.3%4.0$48K
PA Finalization and Correspondence91,60064.4%2.4$186K
PA Auto-Workflow Routing82,20063.4%2.6$22K
PA AI Assisted Clinical Review60,30052.1%2.7$348K
PA Medical Director Review60,10051.2%2.6$756K

Burden is priced from the cost model; the same repeats show up in cost per case below. Repeats are recorded facts, not automatically waste.

View more
Every one of these cases already carries its price
The same recorded visits and touches that put a case on these screens are what Workflow Economics prices below. Move a case today; see what it cost at month end.
// Budget to case · Same record

The CFO's number, priced from the operations record.

Budget vs actual by the month the work started, modeled cost against last year’s baseline and this year’s target, with every dollar traceable to a workflow step and an action. Every count opens the cases behind it; every case opens its ledger.

Total modeled cost
$60.5M
1.64M Cases · Jan – Aug 2026
Cost per Case
$36.90
$39.40 in Jan → $34.40 in Aug
Cases by first touch
1.64M
196k in Jan → 208k in Aug
Implied budget · Operational Goal
$52.5M
$32.00 × 1.64M · over by +$8.0M
Effort in window
$57.9M
work dated Jan – Aug · $2.6M of first-touch cost falls after Aug

Illustrative figures · Monthly detail: Mar–Aug 2026

Cases by first touch · full modeled cost

Each Case booked whole to its first-touch month, beside the budget the target implies.

$10M$7.5M$5M$2.5M$0M$7.8$6.6$7.5$6.4$7.7$6.7$7.7$6.8$7.8$7.1$7.2$6.7Mar205kApr201kMay210kJun214kJul221kAug208kCases
Modeled cost of Cases startedImplied budget · $32.00 × Cases

Cost per Case by first-touch month

Modeled cost against last year’s baseline and the targets you set.

$44$39$34$29$24HISTORICAL FY2025 · $41.20OPERATIONAL GOAL $32.00 · DEC 31, 2026FY2027 GOAL $27.50$38.10$37.20$36.60$35.90$35.10$34.40Mar205kApr201kMay210kJun214kJul221kAug208kCases
Current Process ModelHistoricalGoals

Improvement $6.80 · Gap +$2.40 · Progress 74% · Explore the worked example

// Blind spots

How These Blind Spots Play Out
Across Your Organization

Cost precision, process control, AI proof. The same three gaps show up in every leadership meeting, but hit each role differently.

Who's askingWorkflow EconomicsOperational ControlAI Adoption & ROI
Finance & MeasurementCFO, VP Finance, VP Performance Measurement
Workflow Economics

Cost per case is an average, not an account

Total spend divided by volume, refreshed quarterly. No cost per touch, per rework loop, or per step. The $2 improvement cannot be attributed, so it cannot be defended.

Operational Control

Rework loops are invisible cost drivers

Cases loop 2-3x through the same stages. Nobody quantifies the cost of each loop or the margin it consumes.

AI Adoption & ROI

AI spend has no measurable return

Millions allocated to AI vendors. Budget reviews ask for ROI numbers. All finance has is vendor-reported "efficiency gains."

Clinical LeadershipCMO, VP Clinical Ops, VP Quality
Workflow Economics

The step owner has no number for their step

Targets are set per program, per year. Clinical Review has no share of the target and no way to see its contribution to the gap.

Operational Control

SLA breaches surface after the damage is done

Cases cross 10+ stages. Failures show up in monthly reports, weeks too late. No live view of which cases are at risk right now.

AI Adoption & ROI

AI touches cases but clinical impact is unclear

Told AI reduces turnaround. Can't verify from clinical workflow data. No audit trail for AI-driven decisions.

Operations & Vendor MgmtCOO, VP Vendor Management, VP Transformation
Workflow Economics

A vendor rate card cannot be tested before signing

No way to reprice last year's cases under the proposed rate and compare it to today's staffing on the same work.

Operational Control

Operating model is a black box

1,200+ resources, 3 vendors, AI. No unified view of who performs, who underperforms, or that 60% of cases are unassigned.

AI Adoption & ROI

Can't baseline before vs. after AI

Transformation projects need before/after proof. Without operational baselines, there's no way to measure what AI changed.

IT, Digital & InnovationCIO, CTO, Chief AI Officer, VP Digital Transformation
Workflow Economics

Human vs. AI cost comparison doesn't exist

Can't compare what a case costs when handled by AI vs. human vs. hybrid on one price list. No data to optimize the mix.

Operational Control

No workflow-level data for AI to learn from

AI metrics live in vendor dashboards. Not tied to actual case outcomes, stages, or process context.

AI Adoption & ROI

Can't prove AI ROI to the board

AI deployed across 4+ workflows. Board asks for numbers. All you have is "we think it's helping."

// Use Cases

Where Health Plans Feel It Most

01

Prior Authorization Economics

Price every PA case from its own history: intake, clinical review, MD review, decision. Set the cost-per-case target, give each step its share, and see which step is over it this month.

Learn more
02

Vendor Performance Scorecarding

Hold every delegate accountable with data. Independent, case-level performance and cost for every vendor resource, on the same price list as your own teams.

Learn more
03

Claims Exception Cost

See what happens after the happy path ends. Fall-out, pend aging, denial-rework loops, and the true cost of every exception your auto-adj engine misses.

Learn more
04

AI Business Case & Proof

Model the AI vendor's claim against last year's cases before you sign; then read the actual saving per case in the same ledger once it is live.

Learn more
05

Quality & Stars Visibility

Connect clinical execution to HEDIS and Stars outcomes in real time. See whether UM, CM, and care-gap interventions are actually moving the measures that quality leaders own.

Learn more
06

Pharmacy PA Visibility

Stop managing specialty drug queues from a spreadsheet. Real-time visibility into every pharmacy PA, segmented by drug class, SLA risk, decision stage and cost.

Learn more
The Difference

Already measuring operations with reports, dashboards, or vendor QBRs? See where Operon fits alongside them.

Learn more
// Next Step

Let's See If We Can Help

No pitch deck. No pressure. Just a conversation about what you're trying to solve and whether we're a fit.

Book a Call
Good fit if you're
01
Trying to answer 'what does a case cost?' without a 3-week spreadsheet
02
Setting a cost target and needing each step owner to carry a share of it
03
Running clinical workflows and finding out about SLA breaches weeks after they happen
04
Running AI in production but can't prove the ROI